Flurry Analytics conducted a study on the amount of usage spent on iOS and Android applications. Flurry found that the United States took 55 percent of global app sessions between the two operating systems, with 28 percent being taken by the remaining top 10 countries, and 17 percent controlled by the rest of the world. Read Original Content
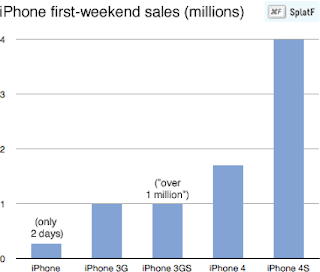
Shortly after the first weekend selling iPhone 4S devices, Apple announced that the company had sold over 4 million units during that three day period. Apple again has set the record for fastest selling electronics device for an opening weekend. Read Original Content
A new report published by Machina Research forecasts the global smart meter growth through 2010-2020. North America is projected to lead the world in the number of connected meters and is on track to reach 1.6 billion smart meters by 2020. Currently the United States and Italy are the global leaders in installed smart meters. Read Original Content
Within the past year the world has experienced rapid growth in the number of mobile applications downloaded. China leads the world with an 870 percent increase in mobile apps since 2010, with Argentina taking second place. The United States does not make the top ten world rankings, however it does control the majority of app sessions. Read Original Content
*************************************************************
Kevin Benedict, Independent Mobile Industry Analyst, Consultant and SAP Mentor Volunteer
Follow me on Twitter @krbenedict
Join the SAP Enterprise Mobility and Sybase Unwired Platform Groups
 |
| Click Here! |


No comments:
Post a Comment